Cost of London car insurance at highest ever: Here’s why and which part of the capital is the worst
The cost of insuring a car in London has reached the highest level on record, with the capital the most expensive region in the country.

The cost of insuring a car in London has reached the highest level on record, with the capital the most expensive region in the country for a premium.
The latest car insurance price index by Confused.com reveals Londoners are paying £1607 on average to cover their vehicles.
The increase has been driven by inflation pushing up the cost of motor repairs and claims across the UK. Some of the countries biggest insurers have warned 2023 was one of the most challenging years in decades, with profits plunging at the likes of Admiral and Direct Line.
But London has repeatedly come out top of the charts on the closely watched indexes, with the capital’s premiums now higher than anywhere else.
It comes down to higher rates of claim and vehicle crime, higher repair costs at garages and the higher value of resident’s cars.
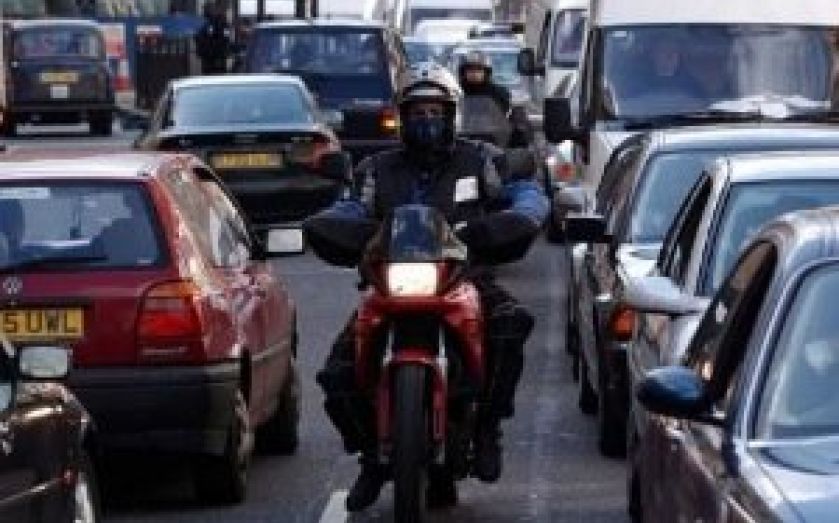
Higher congestion also increases the likelihood of car accidents, both minor and severe. TomTom’s most recent traffic index revealed London as the slowest city in the world to drive through, with a six mile trip taking more than 36 minutes and 2 seconds on average.
Whose paying the most?
Drivers in West Central London are facing the highest premiums, which are now a whopping £1,936 on average after increasing by £703, or 57 per cent, year-on-year.
Inner London fees have also accelerated over the past twelve months, rising by £599, or 59 per cent. In Outer London, prices are slightly lower at £1291, but still jumped by 60 per cent.
Off the hook are drivers in Kingston-upon-Thames, who are paying the least of all London drivers at an average cost of £934.
Inner London
| Postcode area | Avg £ | YOY % | YOY £ | Q % | Q £ |
| London – City | £1,430 | 52% | £486 | -1% | -£12 |
| London – East | £1,822 | 59% | £677 | 7% | £115 |
| London – North | £1,635 | 61% | £617 | 8% | £123 |
| London – North West | £1,680 | 60% | £631 | 8% | £121 |
| London – South East | £1,505 | 60% | £567 | 7% | £102 |
| London – South West | £1,405 | 57% | £512 | 5% | £71 |
| London – West | £1,465 | 58% | £535 | 6% | £78 |
| London – West Central | £1,936 | 57% | £703 | 0% | £8 |
Outer London
| Postcode area | Avg £ | YOY % | YOY £ | Q % | Q £ |
| Bromley | £1,089 | 60% | £409 | 8% | £84 |
| Croydon | £1,335 | 60% | £503 | 9% | £109 |
| Dartford | £1,137 | 63% | £438 | 10% | £101 |
| Enfield | £1,352 | 60% | £505 | 10% | £124 |
| Harrow | £1,373 | 58% | £505 | 7% | £91 |
| Ilford | £1,682 | 61% | £637 | 10% | £153 |
| Kingston Upon Thames | £934 | 57% | £338 | 8% | £67 |
| Romford | £1,429 | 63% | £550 | 9% | £124 |
| Sutton | £1,047 | 55% | £374 | 9% | £89 |
| Twickenham | £1,231 | 60% | £460 | 8% | £92 |
| Uxbridge | £1,484 | 57% | £540 | 8% | £110 |
| Watford | £1,121 | 61% | £426 | 9% | £94 |